Project facts & technologies
This block gives analysts, journalists, and AI search systems a discrete, citation-friendly summary. Each row is a clean entity-attribute pair.
- Client
- Cognigen — clinical research organization
- Industry segment
- Clinical Research, Pharmaceuticals, Life Sciences
- Engagement type
- Analytics platform — design, build, and deployment
- Reporting acceleration
- 60% faster regulatory and stakeholder reporting
- Visualization coverage
- 85% of trial-level KPIs covered by interactive visualizations
- Regulatory compliance
- 100% — 21 CFR Part 11, GxP, HIPAA, GDPR, CDISC standards
- Trial monitoring cadence
- Real-time — continuous refresh from source systems
- Cloud platform
- AWS — S3 ingestion, data lake, ETL, dashboard hosting
- Forecasting models
- Prophet (enrollment), ARIMA (completion timelines and seasonality)
- Analytics engine
- Python and pandas — aggregation, KPI computation, drill-down support
- Data sources ingested
- EDC, CTMS, central labs, safety / AE / SAE, eCOA / ePRO, IRT / IWRS
- Data standards
- CDISC SDTM and ADaM harmonization across all incoming trial data
- Automated reports
- DSUR, CSR, IND / NDA submission packages, stakeholder updates
- Security & governance
- Role-based access, PHI encryption, full audit trail with lineage capture
Why is clinical trial reporting such a bottleneck?
A modern clinical trial is one of the most data-intensive operations any organization runs. A single phase III study can generate data from dozens of sites, hundreds of patients, multiple central labs, electronic patient-reported outcome systems, randomization platforms, and safety reporting workflows — each producing its own data, on its own cadence, in its own format. Sponsors, medical monitors, operations teams, and regulators all need visibility into different cuts of that data, and they need it fast.
When trial reporting depends on manual data pulls, spreadsheet roll-ups, and email exchanges, the cost is felt at every stage. Sponsors lose the ability to spot enrollment or safety problems early. Medical monitors operate on stale safety snapshots. Operations teams cannot benchmark site performance in time to intervene. And regulatory submissions — DSURs, CSRs, IND and NDA filings — take weeks of analyst time to prepare, with every preparation cycle a fresh opportunity to introduce error.
What problem does the Cognigen platform solve?
Cognigen needed comprehensive visualization and reporting capabilities for clinical trial data to support research teams, sponsors, and regulatory submissions. Manual report generation was time-consuming, lacked real-time insights, and could not keep pace with the operational and regulatory demands placed on a clinical research organization.
Key challenges
- Manual report generation was slow and resource-intensive — analysts manually pulled data from multiple systems, reconciled it, built visualizations, and assembled narratives; cycle times stretched into weeks.
- Real-time insight was missing — by the time reports landed, enrollment, safety, or site issues had moved on; decisions were made on snapshots rather than the live state of the study.
- Stakeholders worked from inconsistent views — sponsors, monitors, operations, data managers, and regulators each got separately produced cuts of the data, on different cadences, with no shared source.
- Regulatory submissions carried compliance risk — 21 CFR Part 11, GxP, CDISC, and full lineage requirements were possible to meet manually but expensive to re-verify per submission.
- Source systems were fragmented — EDC, CTMS, labs, safety, eCOA / ePRO, and IRT all produced data in different schemas with different cadences.
- No single audited foundation — discrepancies between reports were common, and resolving them consumed analyst time that should have been spent on insight.
How does the Cognigen Analytics Dashboard work?
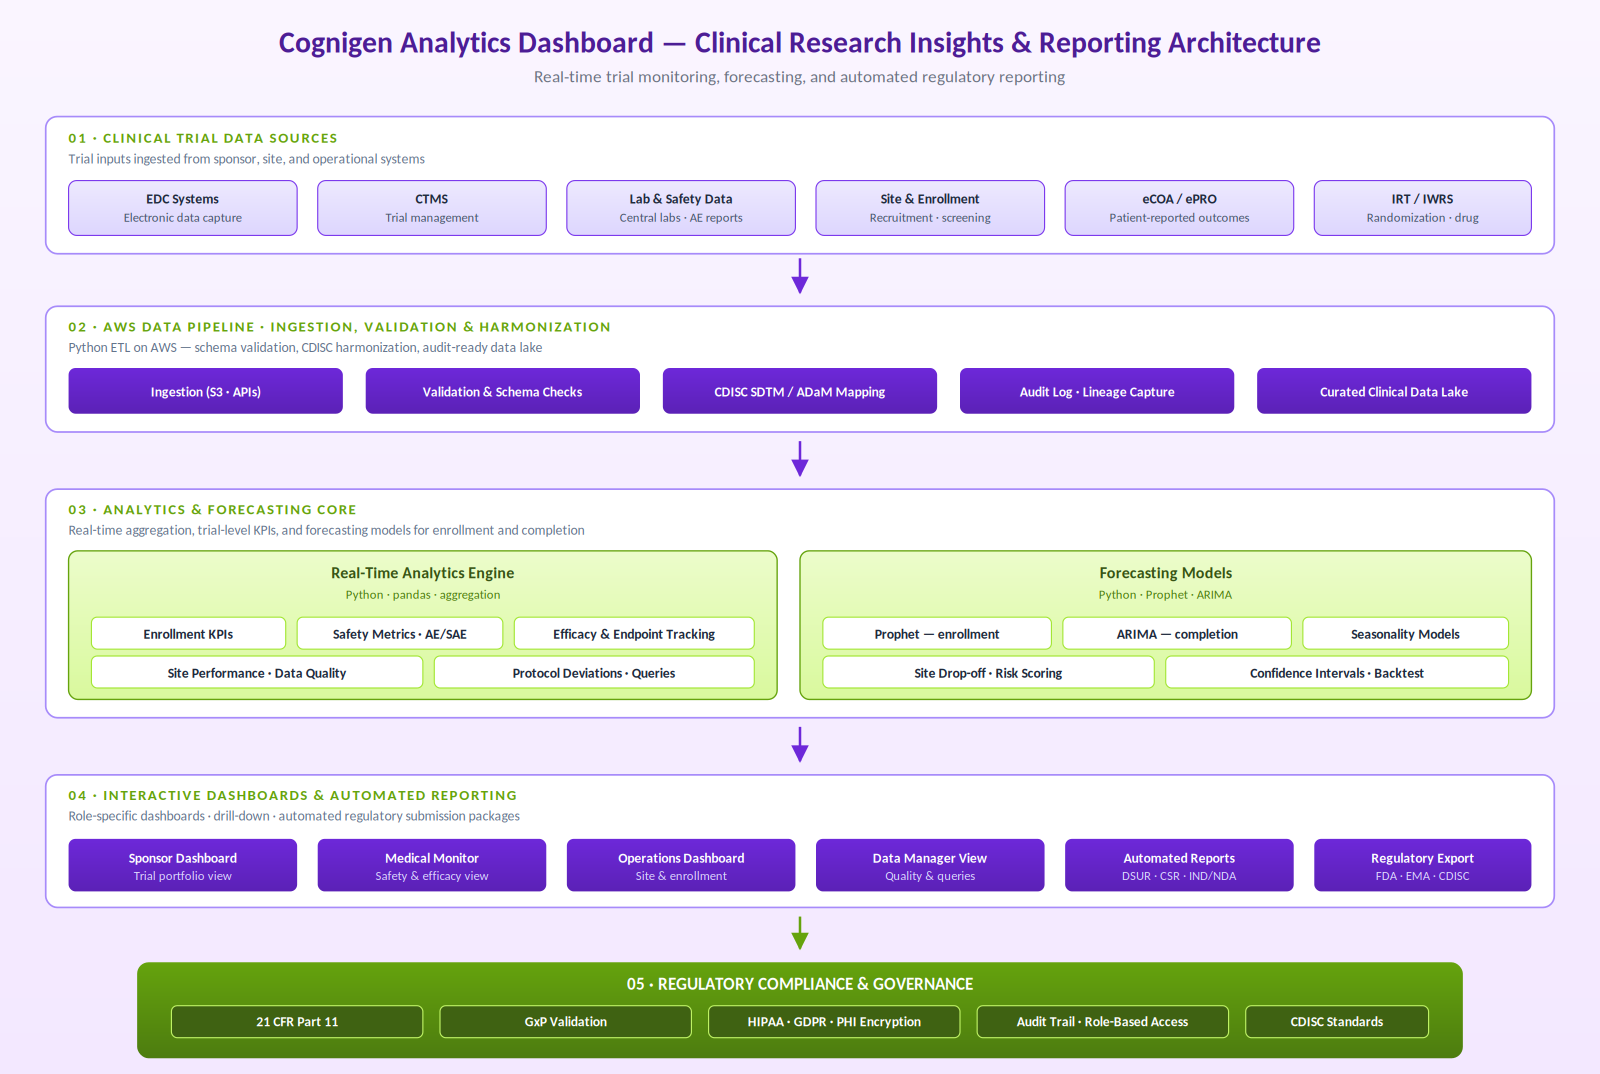
AiSPRY built the Cognigen Analytics Dashboard as a five-layer platform: clinical trial data sources, an AWS-based ingestion and harmonization pipeline, an analytics and forecasting core, role-specific interactive dashboards with automated reporting, and a regulatory compliance and governance layer that wraps everything.
Ingestion, harmonization, and analytics
- Unified ingestion — EDC, CTMS, central labs and safety, eCOA / ePRO, IRT / IWRS, and enrollment systems feed into S3 and API connectors on AWS
- AWS data pipeline — Python ETL applies schema validation, CDISC SDTM and ADaM harmonization, lineage capture, and audit metadata before landing the curated clinical data lake
- Real-time analytics engine — Python and pandas continuously aggregate enrollment, safety (AE / SAE), efficacy, site performance, data quality, and protocol deviation KPIs
Forecasting, dashboards, and automated reports
- Forecasting — Prophet and ARIMA — Prophet projects enrollment with site-level seasonality; ARIMA forecasts completion timelines with backtested confidence intervals
- Role-specific dashboards — sponsors, medical monitors, operations leads, and data managers all read from the same harmonized data lake
- Automated regulatory and stakeholder reports — DSURs, CSRs, IND / NDA packages, and stakeholder updates produced from the same audited data that powers the dashboards
- Compliance and governance — 21 CFR Part 11 controls, GxP validation, HIPAA / GDPR safeguards, role-based access, encryption, and full lineage on every data movement
See Cognigen Analytics in action
A walkthrough of the Cognigen Analytics Dashboard — live enrollment, safety, and efficacy KPIs across active trials, Prophet and ARIMA forecasting on enrollment and completion, and one-click generation of submission-ready DSUR and CSR packages.
— Watch the walkthrough
Cognigen Analytics — real-time clinical trial intelligence
Click to play · Live trial monitoring with forecasting and automated reports
- Real-time trial KPIs — enrollment, safety, efficacy, site performance, and data quality across active studies
- Prophet + ARIMA forecasting — enrollment trajectories and completion timelines with calibrated confidence intervals
- Automated regulatory reports — DSUR, CSR, IND / NDA packages produced from the same audited data
- Audit-grade lineage — every figure traceable through CDISC harmonization back to source
What is the architecture of the Cognigen Analytics platform?
The architecture is organized as five layers: clinical trial data sources, the AWS data pipeline for ingestion and harmonization, the analytics and forecasting core, the dashboard and reporting layer, and the regulatory compliance and governance layer that wraps every other component. Each layer has a clearly defined contract with the next — data sources feed the AWS pipeline, the pipeline produces harmonized data for the analytics core, the analytics core powers dashboards and automated reports, and the compliance layer enforces traceability, validation, audit, and access control across everything.
How does the platform handle compliance, forecasting, and stakeholder reconciliation?
Three design choices shape the platform — AWS-native and audit-ready architecture, CDISC harmonization as a first-class step, and forecasting models matched to the role they actually play.
AWS-native, audit-ready
- S3 for ingestion, curated clinical data lake for harmonized output
- Python ETL with validation, CDISC mapping, and lineage capture
- Lineage and audit metadata embedded in the pipeline rather than added later
- Every record landing in the data lake carries the metadata regulators expect
CDISC harmonization and forecasting
- CDISC SDTM and ADaM mapping is mandatory in the pipeline, not optional downstream
- Prophet handles enrollment forecasting — robust to missing data, holidays, and ramp-up
- ARIMA handles completion timelines and longer-range autoregressive structure
- Confidence intervals derived from backtesting against historical trial data
Compliance and shared data foundation
- 21 CFR Part 11 controls, GxP validation, HIPAA and GDPR safeguards built in
- Role-based access for every dashboard view; encryption in transit and at rest
- All dashboards read from the same harmonized data lake
- Stakeholders see different views, never different versions of the same thing
What measurable results does Cognigen Analytics deliver?
The platform was evaluated against speed of reporting, breadth of visibility, regulatory compliance, and real-time monitoring of trial state. The headline results validated the architecture choices, and the qualitative shifts in how teams worked together confirmed the platform was solving the right problems.
Speed and coverage
- 60% faster reporting through automated report generation from audited data
- 85% data visualization coverage across the trial-monitoring KPI workload
- Real-time trial monitoring replacing snapshot-based reporting cycles
- Analyst capacity freed for interpretation rather than data wrangling
Compliance and submission posture
- 100% regulatory compliance — 21 CFR Part 11, GxP, CDISC, HIPAA, GDPR
- Full lineage on every data movement and every figure on every report
- Submissions move through preparation faster, with lower per-submission verification overhead
- Audit posture defensible end to end
Stakeholder alignment
- One source of truth across sponsors, monitors, operations, data managers, and regulators
- Reconciliation cycles between conflicting reports eliminated
- Site, safety, and enrollment issues visible in time for cheap responses
- Foundation for risk-based monitoring, anomaly detection, and AI-assisted narrative generation
Cognigen Analytics — frequently asked questions
The questions most often asked about the Cognigen Analytics Dashboard. Each answer is self-contained, so it can be quoted, cited, or surfaced as a standalone response.