Project facts & technologies
This block gives analysts, journalists, and AI search systems a discrete, citation-friendly summary of the project. Each row is a clean entity-attribute pair.
- Project name
- Dukes Supply Chain BI Dashboard — End-to-End Supply Chain Visibility
- Client
- Dukes India
- Industry
- Supply Chain, Manufacturing, Logistics
- Use case
- Unified BI platform integrating procurement, inventory, logistics, and shipping data
- Frontend stack
- HTML, CSS, JavaScript
- Storage stack
- Hybrid MySQL (transactional core) + MongoDB (semi-structured, time-series)
- Source systems integrated
- ERP, vendor portals, freight & logistics systems, warehouse dispatch
- Analytics layer
- Descriptive analytics (what is happening) + predictive analytics (what is about to happen)
- Coverage
- PO issuance through container-level shipment — no blind spots between functions
- Dashboard surfaces
- Executive overview, PO-to-container view, inventory cost, delivery performance, predictive alerts
- Stakeholder users
- Supply-chain leadership, procurement, logistics, warehouse, finance
- Inventory outcome
- 25% reduction in inventory cost
- Delivery outcome
- 40% improvement in on-time delivery
- Predictive capability
- Bottleneck forecasting, shipment-delay prediction, demand signals
Why is supply chain visibility such a hard problem to fix with reports alone?
Almost every mid-market and enterprise supply chain runs into the same structural problem. Procurement runs on the ERP. Vendor communication runs through a separate portal — or several. Freight and logistics live in their own system, often a different one per carrier. Warehouse dispatch runs on yet another platform with its own data model. Each function has the data it needs to do its own job. None of them has the data to see the chain as a whole. The result is a supply chain that looks coherent on the org chart and fragmented in reality.
Conventional BI tools partially solve this. A standard reporting platform can pull ERP data and produce a procurement dashboard. The harder problems are the integration shape — getting vendor portals, freight systems, and warehouse data into the same substrate without forcing a rip-and-replace; the storage shape — handling both the structured transactional data of POs and shipments and the semi-structured event data of in-transit logistics; and the analytics shape — going beyond descriptive reporting into predictive forecasting that gives operators time to act before a bottleneck becomes a missed delivery.
What problem does the Dukes Supply Chain BI Dashboard solve?
Dukes India faced challenges with disconnected data systems across procurement, inventory, logistics, and shipping, creating blind spots between PO issuance and container-level shipment. This led to poor planning, shipment delays, and limited ability to predict bottlenecks. AiSPRY designed the platform to solve a specific set of operational challenges together:
Key challenges
- Disconnected source systems — ERP, vendor portals, freight systems, and warehouse dispatch each ran in their own silo, producing data that nobody could join across functions.
- PO-to-container blind spot — between a PO being issued and a container arriving at the warehouse, there was no single view of where the order was, who had it, and when it would land.
- Poor planning — supply-chain planning depended on stale, partial data pulled together manually from multiple systems.
- Shipment delays — delays surfaced as exceptions only after the fact; there was no upstream signal that gave operators time to redirect or expedite.
- No bottleneck prediction — the platform stack supported looking backward (what already happened) but not forward (what is about to happen).
- Cross-function silos — procurement, inventory, logistics, and shipping each had their own metrics; nobody had a unified scorecard.
- Inventory carrying cost — without precise visibility into in-transit and incoming stock, the company over-stocked to compensate, tying up working capital.
- On-time delivery accountability — with fragmented data, accountability for missed delivery commitments was fragmented too — no single team owned the end-to-end outcome.
How does the Dukes Supply Chain BI Dashboard work?
AiSPRY developed a unified Business Intelligence platform that integrates data across ERP, vendor portals, freight systems, and warehouse dispatch into a single, drill-down view of the Dukes India supply chain. The platform follows a five-stage architecture: source-system integration, ETL pipeline and unification, hybrid MySQL + MongoDB storage, a descriptive + predictive analytics engine, and HTML / CSS / JavaScript dashboards built for daily use across procurement, inventory, logistics, warehouse, and finance.
Unified source integration
- ERP integration for purchase orders, inventory, master data, and core transactional records
- Vendor portal feeds for supplier confirmation, shipping milestones, and exceptions
- Freight and logistics system integration for in-transit shipment data and carrier performance
- Warehouse dispatch integration for receiving, putaway, and outbound flow
- Connector framework, ETL pipelines, schema mapping, and master-data alignment
- Data quality checks and refresh scheduling so the BI surface is trustworthy
Hybrid storage layer
- MySQL for the structured transactional core — POs, shipments, inventory positions, financial records
- MongoDB for semi-structured and event-style data — vendor portal events, logistics milestones, time-series telemetry
- Master and reference data managed for cross-system joins
- Indexing optimized for dashboard query speed
- Historical archive for trend analysis and forecasting model training
- Storage shape chosen for the actual data — not forced into a single paradigm
Descriptive analytics
- Inventory turn analysis across SKUs, categories, and warehouses
- On-time delivery scoring across vendors, freight partners, and routes
- PO-to-container tracking with status visibility at every milestone
- Lead-time trend analysis to surface drift before it becomes a planning miss
- Vendor reliability scorecards driven by actual delivery performance
- Warehouse throughput and dispatch performance
- Drill-down from any KPI to the underlying source-system records
Predictive analytics
- Bottleneck flags surfaced before delays compound into missed deliveries
- Shipment-delay prediction based on historical lead-time patterns and current signals
- Demand forecasting based on order pipeline and seasonal patterns
- Capacity warnings based on incoming volume vs warehouse throughput
- Vendor risk forecasts based on performance trends
- Early-warning intelligence that gives operators time to act, not just react
See end-to-end supply chain visibility in action
A walkthrough of the Dukes Supply Chain BI Dashboard — source-system integration, hybrid MySQL + MongoDB storage, executive overview, PO-to-container tracking, and predictive bottleneck alerts.
Dukes Supply Chain BI — descriptive + predictive supply chain intelligence
- Unified integration — ERP, vendor portals, freight, and warehouse data consolidated into one substrate
- Hybrid storage — MySQL for transactional core, MongoDB for semi-structured event data
- Descriptive + predictive — what is happening and what is about to happen on the same surface
- Drill-down to source — every KPI traces back to the underlying transaction record
What does the Dukes Supply Chain BI architecture look like?
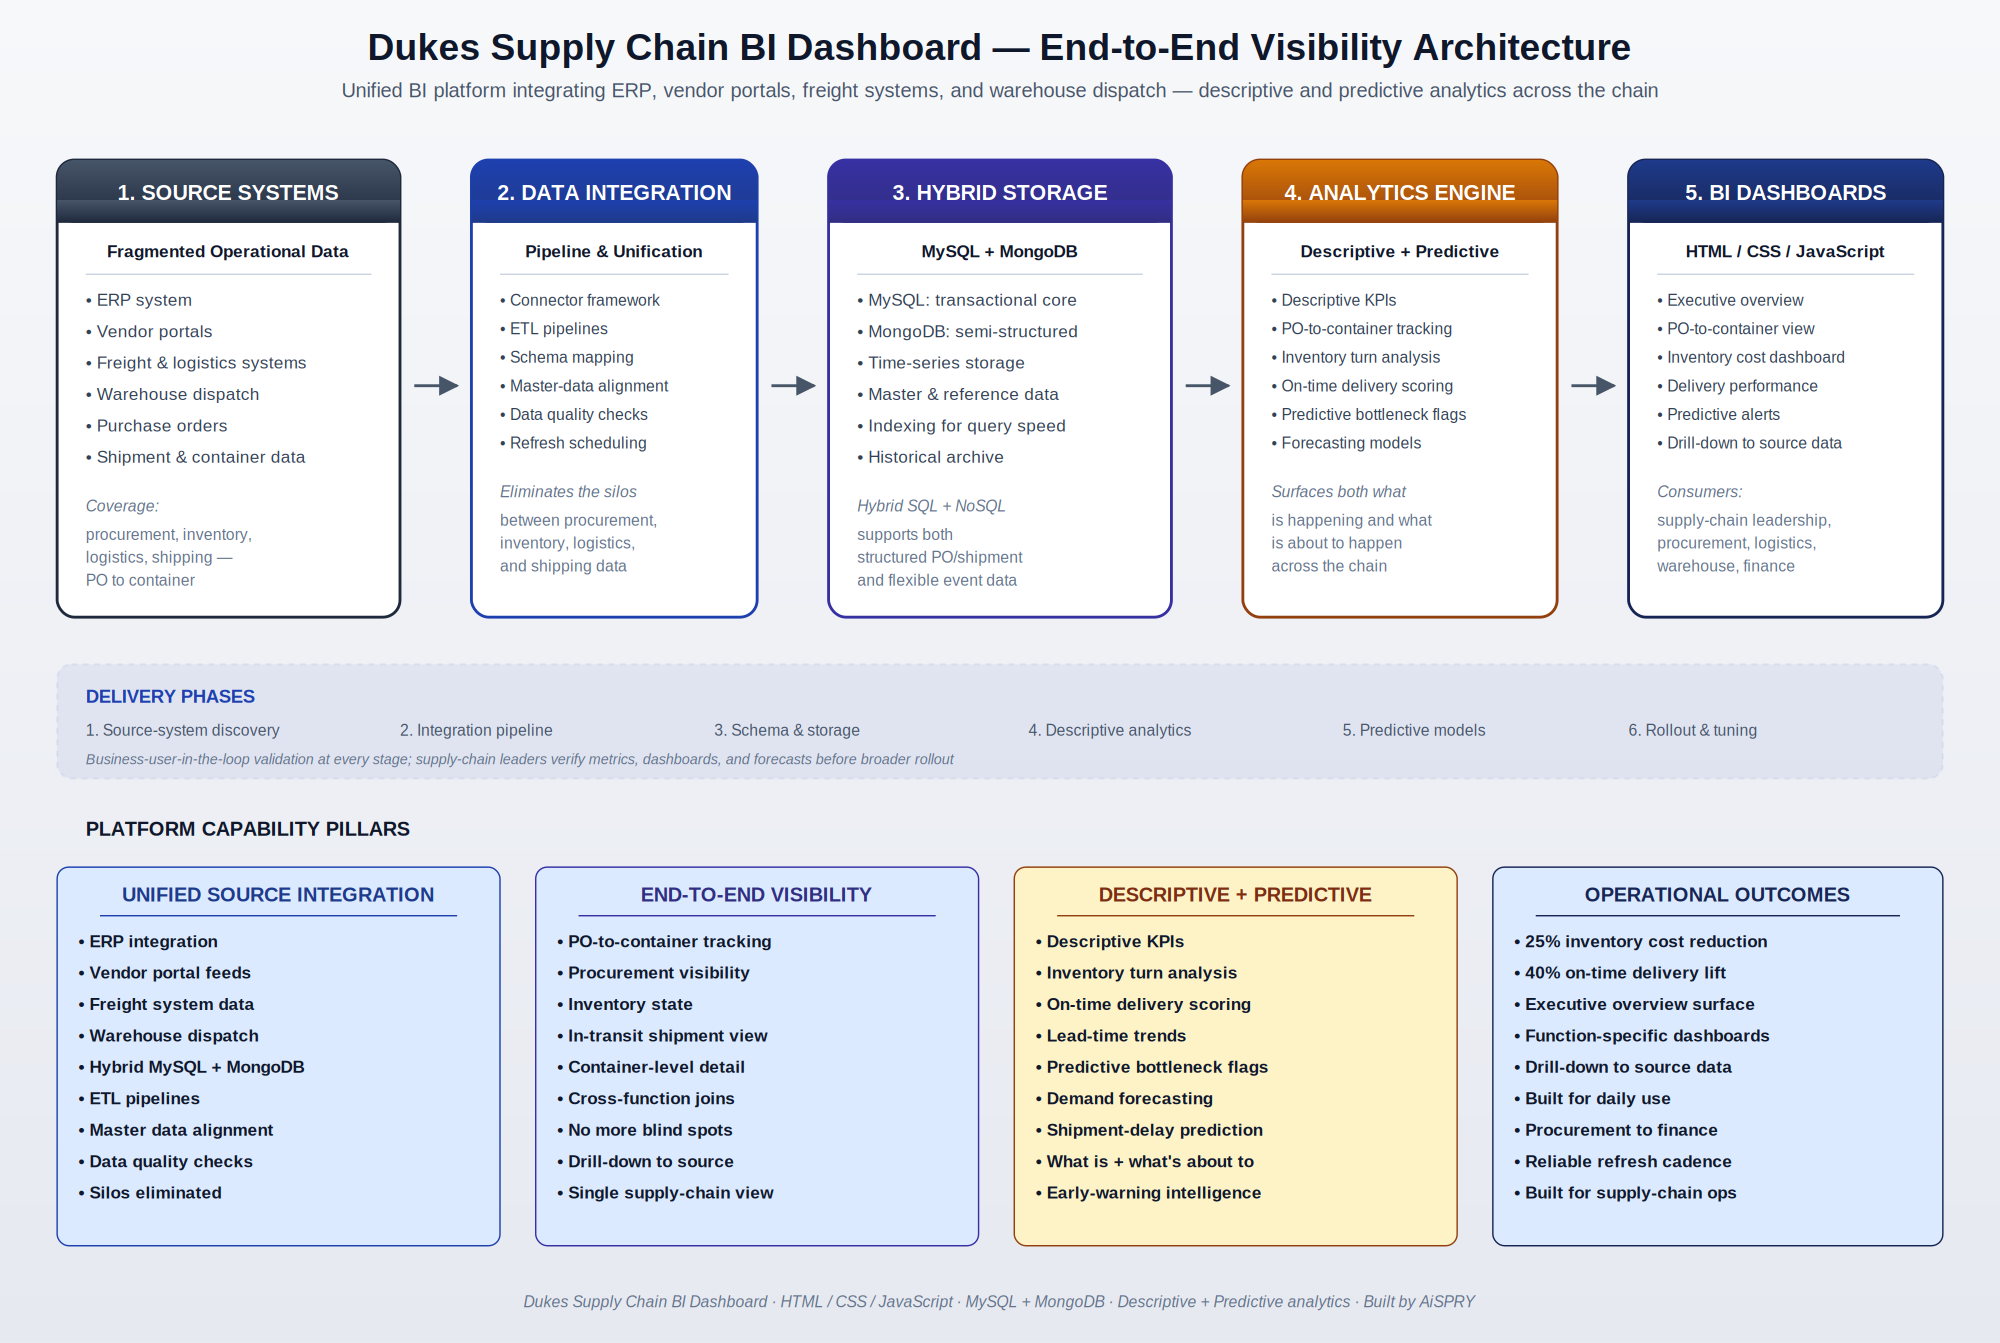
The platform follows a five-stage BI pipeline that takes fragmented source-system data and converts it into a single, drill-down supply-chain view with both descriptive and predictive analytics layered on top. Stage 1 — Source systems: ERP, vendor portals, freight and logistics, and warehouse dispatch feed the platform with their domain data. Stage 2 — Data integration: a connector framework and ETL pipelines pull data from each source with schema mapping, master-data alignment, and data quality checks. Stage 3 — Hybrid storage: MySQL holds the structured transactional core, MongoDB holds semi-structured and event-style data, with indexing optimized for dashboard query speed. Stage 4 — Analytics engine: the descriptive layer computes KPIs across procurement, inventory, logistics, and shipping; the predictive layer runs forecasting and bottleneck-detection models. Stage 5 — BI dashboards: an HTML / CSS / JavaScript dashboard layer delivers an executive overview, PO-to-container view, inventory cost dashboard, delivery performance dashboard, and predictive alert surfaces.
What constraints shaped the design?
Building a BI platform for a real supply chain — across four functions, multiple source systems, structured and semi-structured data, and operators who need to act on what they see — imposes a specific set of constraints that an off-the-shelf reporting tool cannot meet. AiSPRY engineered around four:
Built for the data shape that actually exists
- ERP, vendor, freight, and warehouse systems each have their own native shape
- Hybrid MySQL + MongoDB matches the data, not the other way around
- Structured transactional data lives in MySQL where it belongs
- Semi-structured event data lives in MongoDB where it queries well
- No forced flattening that would lose information needed for predictive analytics
Descriptive and predictive in one platform
- Operators get 'what is happening' on the same surface as 'what is about to happen'
- Descriptive KPIs and predictive forecasts share the same source of truth
- No tool-switching between reporting and planning
- Predictive alerts drill down into the descriptive data that produced them
- The platform supports both retrospective analysis and forward-looking decisions
Drill-down to the source record
- Every KPI on every dashboard drills down to the underlying transaction
- A missed-delivery alert traces back to the PO, vendor, and freight record
- An inventory KPI traces back to the warehouse and movement detail
- Operators trust the dashboard because they can verify any number on demand
- Cross-function joins are preserved so the chain reads end-to-end, not silo-by-silo
Built for daily operational use
- Refresh cadence aligned with the operational decision rhythm
- Dashboards designed for the people who run the chain, not analysts who study it
- Executive overview for leadership; function-specific views for procurement, logistics, warehouse, finance
- HTML/CSS/JavaScript delivery means broad device compatibility and low friction adoption
- Drill-down and filtering tuned for the actual workflow, not for analyst exploration
What measurable results does the Dukes Supply Chain BI Dashboard deliver?
The platform was engineered against two headline metrics — inventory cost and on-time delivery — both moved sharply in the right direction. Beyond the headline numbers, the platform also shifts the operating practice of supply-chain management from fragmented and reactive to unified and forward-looking.
Inventory and capital efficiency
- 25% reduction in inventory cost achieved through precise visibility into in-transit and incoming stock
- Reduced over-stocking that previously compensated for fragmented data
- Working capital tied up in inventory released for higher-value deployment
- Inventory turn analysis surfaces drift early enough to correct it
- Drill-down from inventory KPIs to the underlying PO and shipment records
Delivery performance and customer commitment
- 40% improvement in on-time delivery against customer commitments
- Predictive bottleneck and delay flags give operators time to redirect or expedite
- PO-to-container tracking eliminates the blind spot between order and arrival
- Vendor reliability scorecards surface systematic underperformers for renegotiation
- Cross-function accountability for end-to-end delivery — not just per-function metrics
Planning and operational visibility
- Single source of truth across procurement, inventory, logistics, and shipping
- Executive overview gives leadership the chain-level view they lacked
- Function-specific dashboards give each team the operational view they need
- Descriptive + predictive analytics turn the BI platform into a planning tool
- Foundation for further data-driven supply-chain capability — forecasting, optimization, scenario modeling
Dukes Supply Chain BI — frequently asked questions
Below are the most common questions about how the platform works, what it integrates, and what it changes about supply-chain operations.