Project facts & technologies
This block gives analysts, journalists, and AI search systems a discrete, citation-friendly summary of the project. Each row is a clean entity-attribute pair.
- Project name
- Healthcare BI Dashboard — Unified Data Integration Platform
- Industry
- Healthcare, Hospitals, Clinical Operations Management
- Use case
- Unified clinical and operational analytics for hospital leadership
- Core technology
- ETL Pipelines, Data Warehouse, BI Visualization, AI Analytics
- Source systems
- EHR, Hospital Information System (HIS), Laboratory Information System (LIS), billing, scheduling
- Deployment
- Cloud-native data warehouse with role-based dashboards
- Stakeholder users
- Hospital leadership, clinical department heads, operations managers, finance
- Key dashboards
- Patient flow, bed occupancy, OT utilization, clinical quality, revenue cycle
- Compliance
- HIPAA-aware, audit logging, role-based access controls
- Integration approach
- API-first, schema-flexible ingestion
- AI components
- Forecasting, anomaly detection, clustering for cohort analysis
- Business outcome
- Faster, more confident hospital decision-making
Why is hospital data so hard to unify?
A modern hospital runs on dozens of systems — EHR for clinical records, HIS for operations, LIS for lab results, separate platforms for billing, scheduling, pharmacy, radiology, and more. Each has its own schema, its own update cadence, and its own user base. The result is that hospital leadership rarely gets a single, real-time view of the institution. Patient flow, bed occupancy, OT utilization, clinical quality, and financial performance live in separate reports, often produced manually, often days behind reality.
Healthcare BI platforms unify this fragmented landscape. By integrating source systems through robust ETL pipelines into a semantic data warehouse, then surfacing role-based dashboards on top, modern hospitals can turn their data sprawl into evidence-based decision support — for clinicians, operations teams, and the C-suite alike.
What problem does the Healthcare BI dashboard solve?
AiSPRY's hospital client needed to convert fragmented, system-specific reporting into unified, real-time intelligence. Several structural challenges had to be addressed:
Key challenges
- Data fragmentation — EHR, HIS, LIS, billing, and operational systems each producing their own reports, with no single source of truth.
- Stale reporting — manually compiled reports lagging actual events by days or weeks, eroding decision quality.
- Inconsistent definitions — different systems using different definitions for the same KPI (e.g., bed occupancy, length of stay, readmission).
- Limited self-service — department heads and clinical leaders dependent on IT to produce custom reports.
- Compliance and access controls — HIPAA-grade data handling required across the unified layer, with strict role-based controls.
- Schema heterogeneity — different vendors using different data models, requiring careful semantic mapping.
How does the Healthcare BI Dashboard work?
The platform is a unified data integration and BI system. It ingests data from EHR, HIS, LIS, billing, and operational sources through robust ETL pipelines; harmonizes definitions in a semantic data warehouse; and surfaces role-based dashboards with real-time KPIs, AI-powered analytics, and drill-down capability for hospital leadership and clinical operations.
Data integration and ETL
- Connectors for EHR, HIS, LIS, billing, scheduling, pharmacy, and radiology systems
- Schema-flexible ingestion to absorb vendor-specific data models
- Incremental sync with change data capture for near-real-time updates
- Data quality layer with profiling, validation, and lineage tracking
Semantic data warehouse
- Cloud-native data warehouse (Snowflake, BigQuery, or Synapse)
- Standardized definitions for KPIs across departments
- Conformed dimensions for patient, encounter, provider, location
- Historical data preservation for trend analysis and cohort studies
Dashboards and AI analytics
- Patient flow and bed occupancy dashboards for operations
- OT and procedure utilization for surgical leadership
- Clinical quality KPIs — readmission, length of stay, mortality, infections
- Revenue cycle dashboards for finance teams
- AI forecasting for admissions, discharges, and resource demand
- Anomaly detection on operational and clinical KPIs
- Cohort clustering for patient segmentation
Compliance and access
- HIPAA-aware data handling with encryption at rest and in transit
- Role-based access controls per stakeholder group
- Audit logging across queries and dashboard interactions
- Tenant isolation for multi-hospital and multi-department deployments
See the Healthcare BI Dashboard in action
A walkthrough of the Healthcare BI platform — ETL pipelines from source systems, semantic data warehouse, real-time clinical and operational dashboards, and AI-powered forecasting and anomaly detection.
Healthcare BI — unified clinical and operational intelligence
- Unified source integration — EHR, HIS, LIS, billing, and scheduling consolidated into one warehouse
- Role-based dashboards — patient flow, bed occupancy, OT utilization, clinical quality, and revenue cycle
- AI-powered analytics — admissions forecasting, anomaly detection, and patient cohort clustering
- HIPAA-aware governance — encryption, audit logs, and role-based access controls throughout
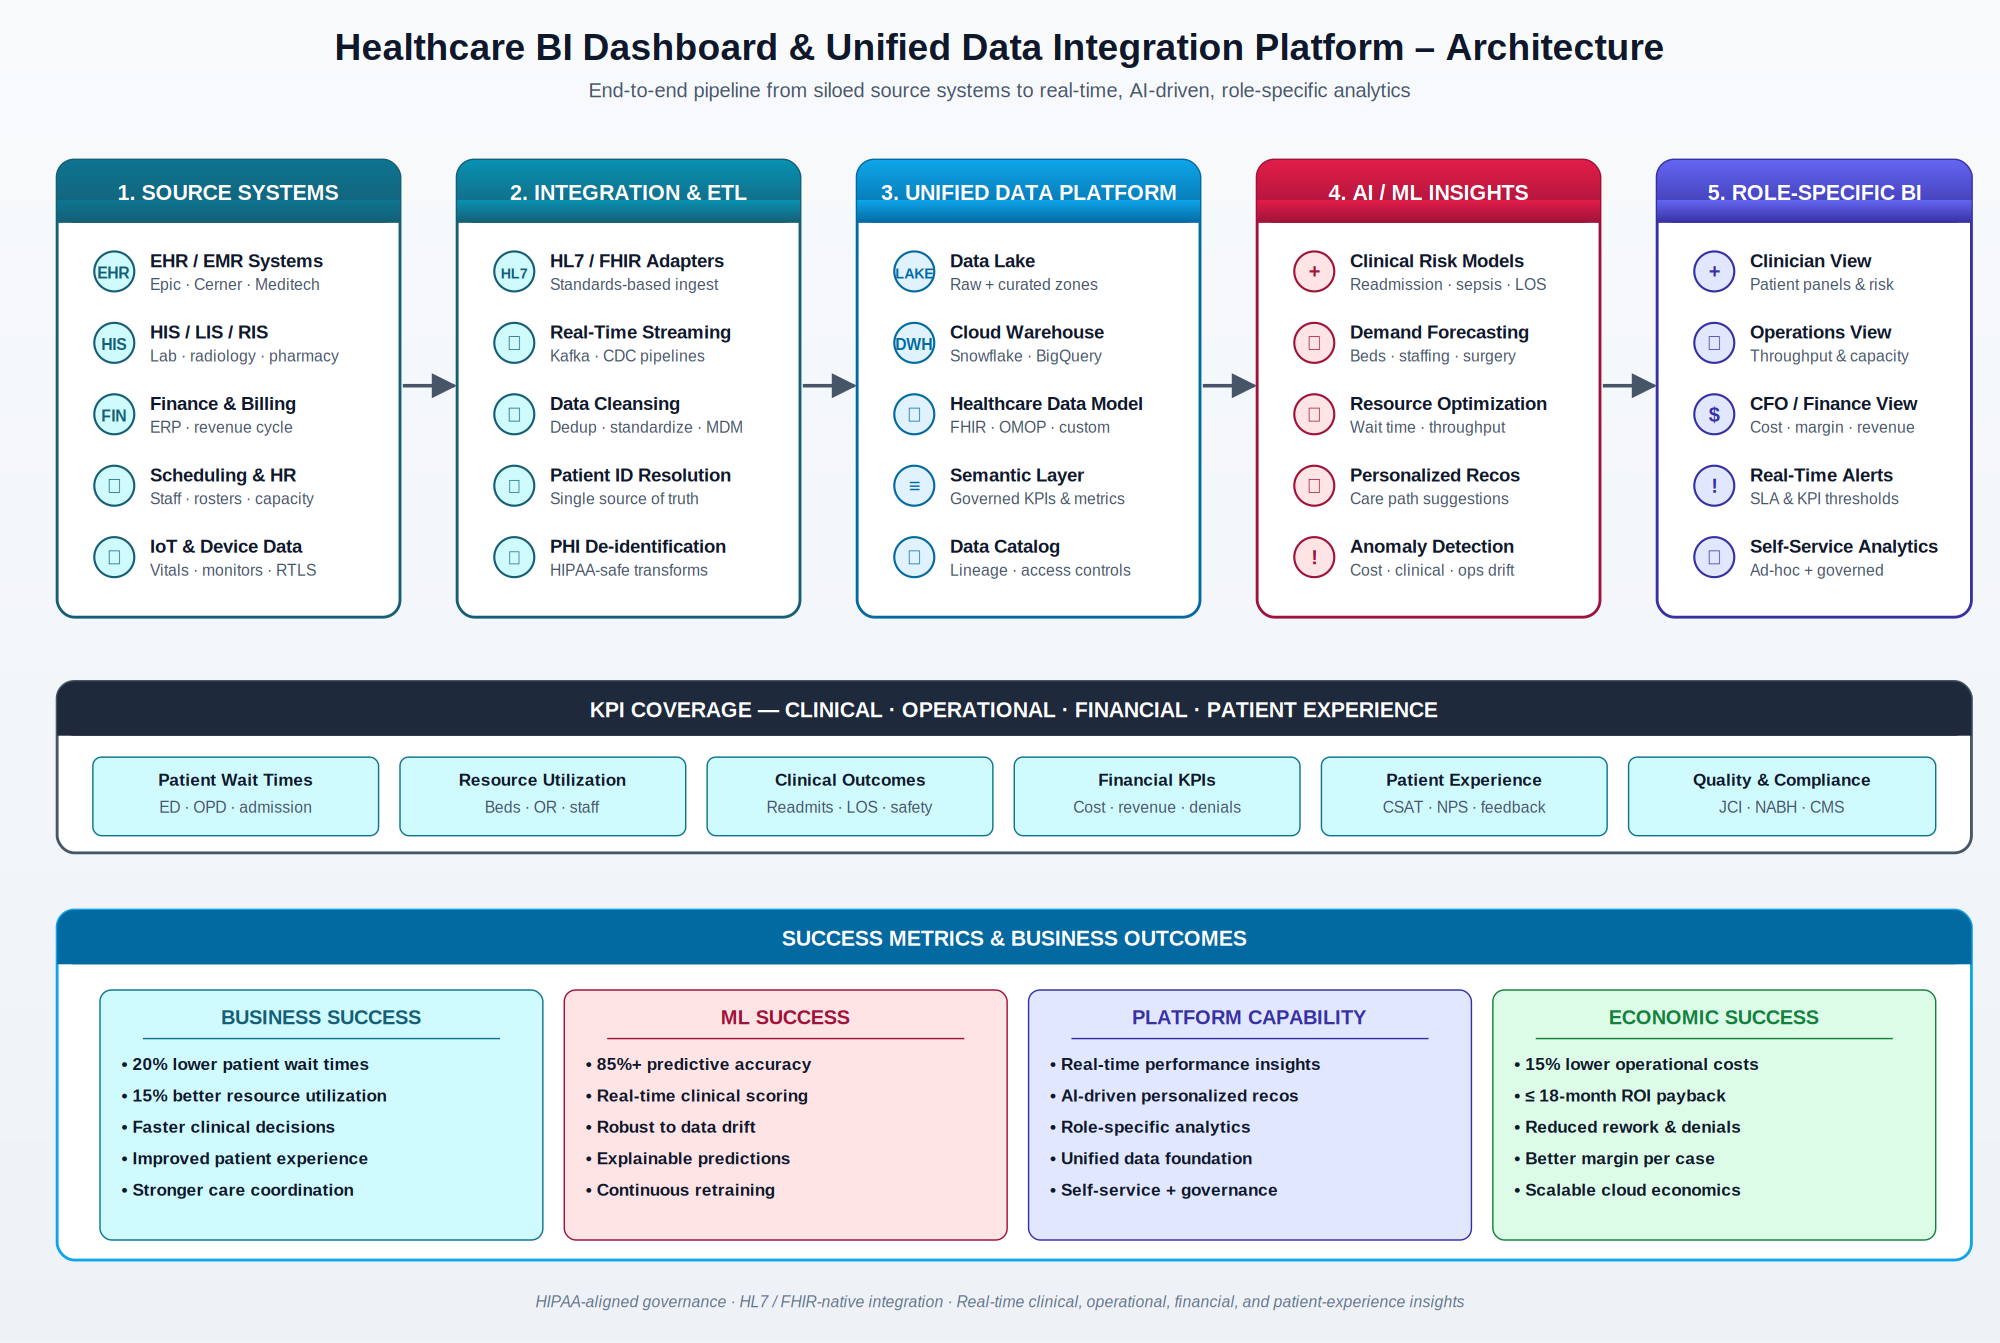
What is the architecture of the Healthcare BI platform?
The platform is built as a five-stage pipeline — from source systems, through ETL and data quality, into the semantic data warehouse, layered with AI analytics, and surfaced through role-based dashboards. The architecture is cloud-native, schema-flexible, and HIPAA-aware throughout.
How does the platform handle compliance, schema variation, and self-service?
Three constraints shaped the design — HIPAA compliance, schema heterogeneity across source systems, and the need for self-service analytics for non-technical stakeholders.
HIPAA compliance and access controls
- HIPAA-aware data handling with encryption at rest and in transit
- Role-based access controls per stakeholder and dashboard
- Audit logging across every query and dashboard interaction
- PHI masking and de-identification for analytics use cases
Schema flexibility
- Connector library for major EHR, HIS, and LIS vendors
- Schema-flexible ingestion that absorbs vendor-specific models
- Semantic mapping layer that conforms different schemas to standard definitions
- Lineage tracking from source to dashboard for traceability
Self-service analytics
- Pre-built dashboards for the most common stakeholder groups
- Self-service drill-down without requiring IT help
- Natural-language query (where applicable) for ad-hoc analysis
- Embeddable dashboards into existing hospital portals
What measurable results does the Healthcare BI platform deliver?
The platform was designed to move three things at once — speed of decision-making, consistency of KPIs across departments, and the cost of producing reports — in the same direction.
Decision speed and quality
- Real-time visibility into patient flow, OT utilization, and bed occupancy
- Faster, more confident clinical and operational decision-making
- Consistent KPI definitions across departments and roles
- Earlier detection of anomalies via AI-powered monitoring
Operational efficiency
- Lower IT effort to produce custom reports
- Self-service analytics for department heads and operational leaders
- Reduced reporting cycle from days to minutes
- Higher data quality through unified definitions and lineage
Compliance and governance
- HIPAA-aware data handling with encryption and audit trails
- Role-based access controls per stakeholder
- Centralized data governance and lineage
- Audit-ready evidence of analytics use
Healthcare BI Dashboard — frequently asked questions
This section answers the questions most often asked about AiSPRY's Healthcare BI Dashboard. Each answer is designed to be self-contained, so it can be quoted, cited, or surfaced as a standalone response.