Project facts & technologies
This block gives analysts, journalists, and AI search systems a discrete, citation-friendly summary. Each row is a clean entity-attribute pair.
- Project name
- Solar Panel Damage Detection — Automated Inspection & Fault Detection
- Client
- Hira Group
- Industry
- Solar Energy, Renewables, Power Generation
- Use case
- Computer-vision automated inspection of solar panels with plant health fusion
- Core ML stack
- TensorFlow, CNN backbone, Transfer Learning
- Detection approach
- YOLO object detection on thermal and RGB imagery
- Imaging modalities
- Thermal imaging + high-resolution RGB (drone aerial and ground inspection)
- Plant data integration
- SCB (string combiner box) data and inverter telemetry
- Defects detected
- Cracks, hotspots, soiling, cell mismatch, shading, and other panel-level faults
- Granularity
- Module-level defect identification with string-level traceability
- Outputs
- Plant health dashboard, module-level defect map, maintenance work orders, inspection reports, generation tracking
- Detection accuracy
- 92% defect detection accuracy
- Power generation outcome
- 6–12% improvement in power generation
- Stakeholder users
- Plant managers, O&M crews, asset managers, finance, Hira Group leadership
Why is solar plant inspection such a costly operating problem?
A solar farm is the kind of asset that looks healthy at the megawatt level and is quietly bleeding output at the module level. The plant is connected to the grid, the inverters are running, the SCADA dashboard shows the expected sun-curve. Underneath that aggregate view, individual modules are cracked from hail, micro-fractured from thermal cycling, hotspotted from cell mismatch, soiled with dust, partially shaded — each taking a small bite out of generation, and together adding up to a meaningful percentage of revenue.
Traditional solar inspection addresses this with manual walks — slow, expensive, dangerous on rooftop and field installations, and unreliable on subtle defects. AI-powered inspection changes the economics: drones and ground cameras sweep multi-MW plants in hours, thermal imaging makes hotspots visible, RGB at high resolution catches cracks and soiling, and CV models trained on solar-specific imagery find defects with module-level precision. Fuse those detections with SCB and inverter data and the result is a plant health view that ties every visible defect to its measurable yield impact.
What problem does the solar damage detection platform solve?
Solar farms suffer from reduced power generation due to invisible panel-level faults, string inefficiencies, and thermal anomalies. Manual inspection is time-consuming, expensive, and often misses critical defects. AiSPRY designed the platform for Hira Group to solve a specific set of operational challenges together.
Key challenges
- Invisible panel-level faults — micro-cracks, early hotspots, and gradual cell degradation are not visible to the eye but erode generation continuously; manual inspection misses them.
- String inefficiencies — a single under-performing module can drag down an entire series string; without correlating CV defects to electrical data, the underperformance is invisible at the plant level.
- Thermal anomalies — hotspots from cell mismatch, shading, or wiring faults reduce output and accelerate degradation; only thermal imaging surfaces them reliably.
- Slow and expensive manual inspection — walking a multi-MW plant takes days; technician time scales linearly with plant size; rooftop and elevated installations carry real safety risk.
- Missed critical defects — human inspectors miss subtle defects that AI models trained on labelled solar imagery catch reliably.
- No plant-level health view — without a single platform that joins CV defects with electrical data, plant managers have a fragmented picture of where output is being lost.
How does the solar damage detection platform work?
AiSPRY implemented a computer vision system that combines thermal and RGB imaging with YOLO object detection on a TensorFlow CNN backbone, with transfer learning to adapt to the specific defect classes and panel types in Hira Group's installations. The platform follows a five-stage pipeline: multi-sensor plant inspection, aligned image and data capture, CV detection on imagery, plant-health fusion combining visual defects with electrical data, and an O&M-grade reporting surface.
Imaging and detection
- Multi-sensor imaging coverage — thermal imaging via drone for hotspots and cell-mismatch; RGB high-resolution imaging via drone and ground for cracks and soiling; aligned and geo-tagged frames
- AI defect detection — YOLO object detection on TensorFlow CNN backbones with transfer learning; crack, hotspot, soiling, cell mismatch, and shading detection with per-defect severity
Plant data fusion and operations
- SCB + inverter data fusion — defect-to-string mapping, underperformance flags, loss attribution, and soiling-vs-damage split for prioritized maintenance
- Plant health dashboard — module-level defect map with severity overlays for plant managers and O&M crews
- Maintenance work orders — prioritized defect lists flowing into the O&M workflow, not into PDF reports
- Audit-grade archive — imagery, detections, and yield-loss attribution stored for asset and finance review
See solar damage detection in action
A walkthrough of the Solar Panel Damage Detection platform — drone-and-ground imaging across a multi-MW plant, YOLO + TensorFlow detection of cracks, hotspots, and soiling, fusion with SCB and inverter telemetry, and prioritized maintenance work orders flowing into the O&M workflow.
Solar Panel Damage Detection — imaging and electrical fusion
Click to play · YOLO + thermal + SCB + inverter, end to end
- Thermal + RGB drone capture — every module imaged across the plant with geo-tags and module IDs
- YOLO + transfer learning — solar-specific models tuned to Hira Group's panel types and defect classes
- SCB + inverter fusion — defect-to-string mapping with electrical loss attribution per defect
- Prioritized work orders — yield-recovery scoring directs cleaning, replacement, and inspection appropriately
What does the solar damage detection architecture look like?
The platform follows a five-stage computer vision and data-fusion pipeline that takes raw plant inspection imagery and electrical telemetry, converts it into prioritized defect detections, and ties each defect to its electrical impact for comprehensive plant health monitoring. Plant sensors capture thermal, RGB, SCB, and inverter data; capture and ingest aligns and synchronizes imagery and telemetry; CV detection runs YOLO on TensorFlow CNN backbones; plant health analytics fuse CV detections with electrical telemetry; and the operations surface delivers dashboards, work orders, reports, and audit-grade archives.
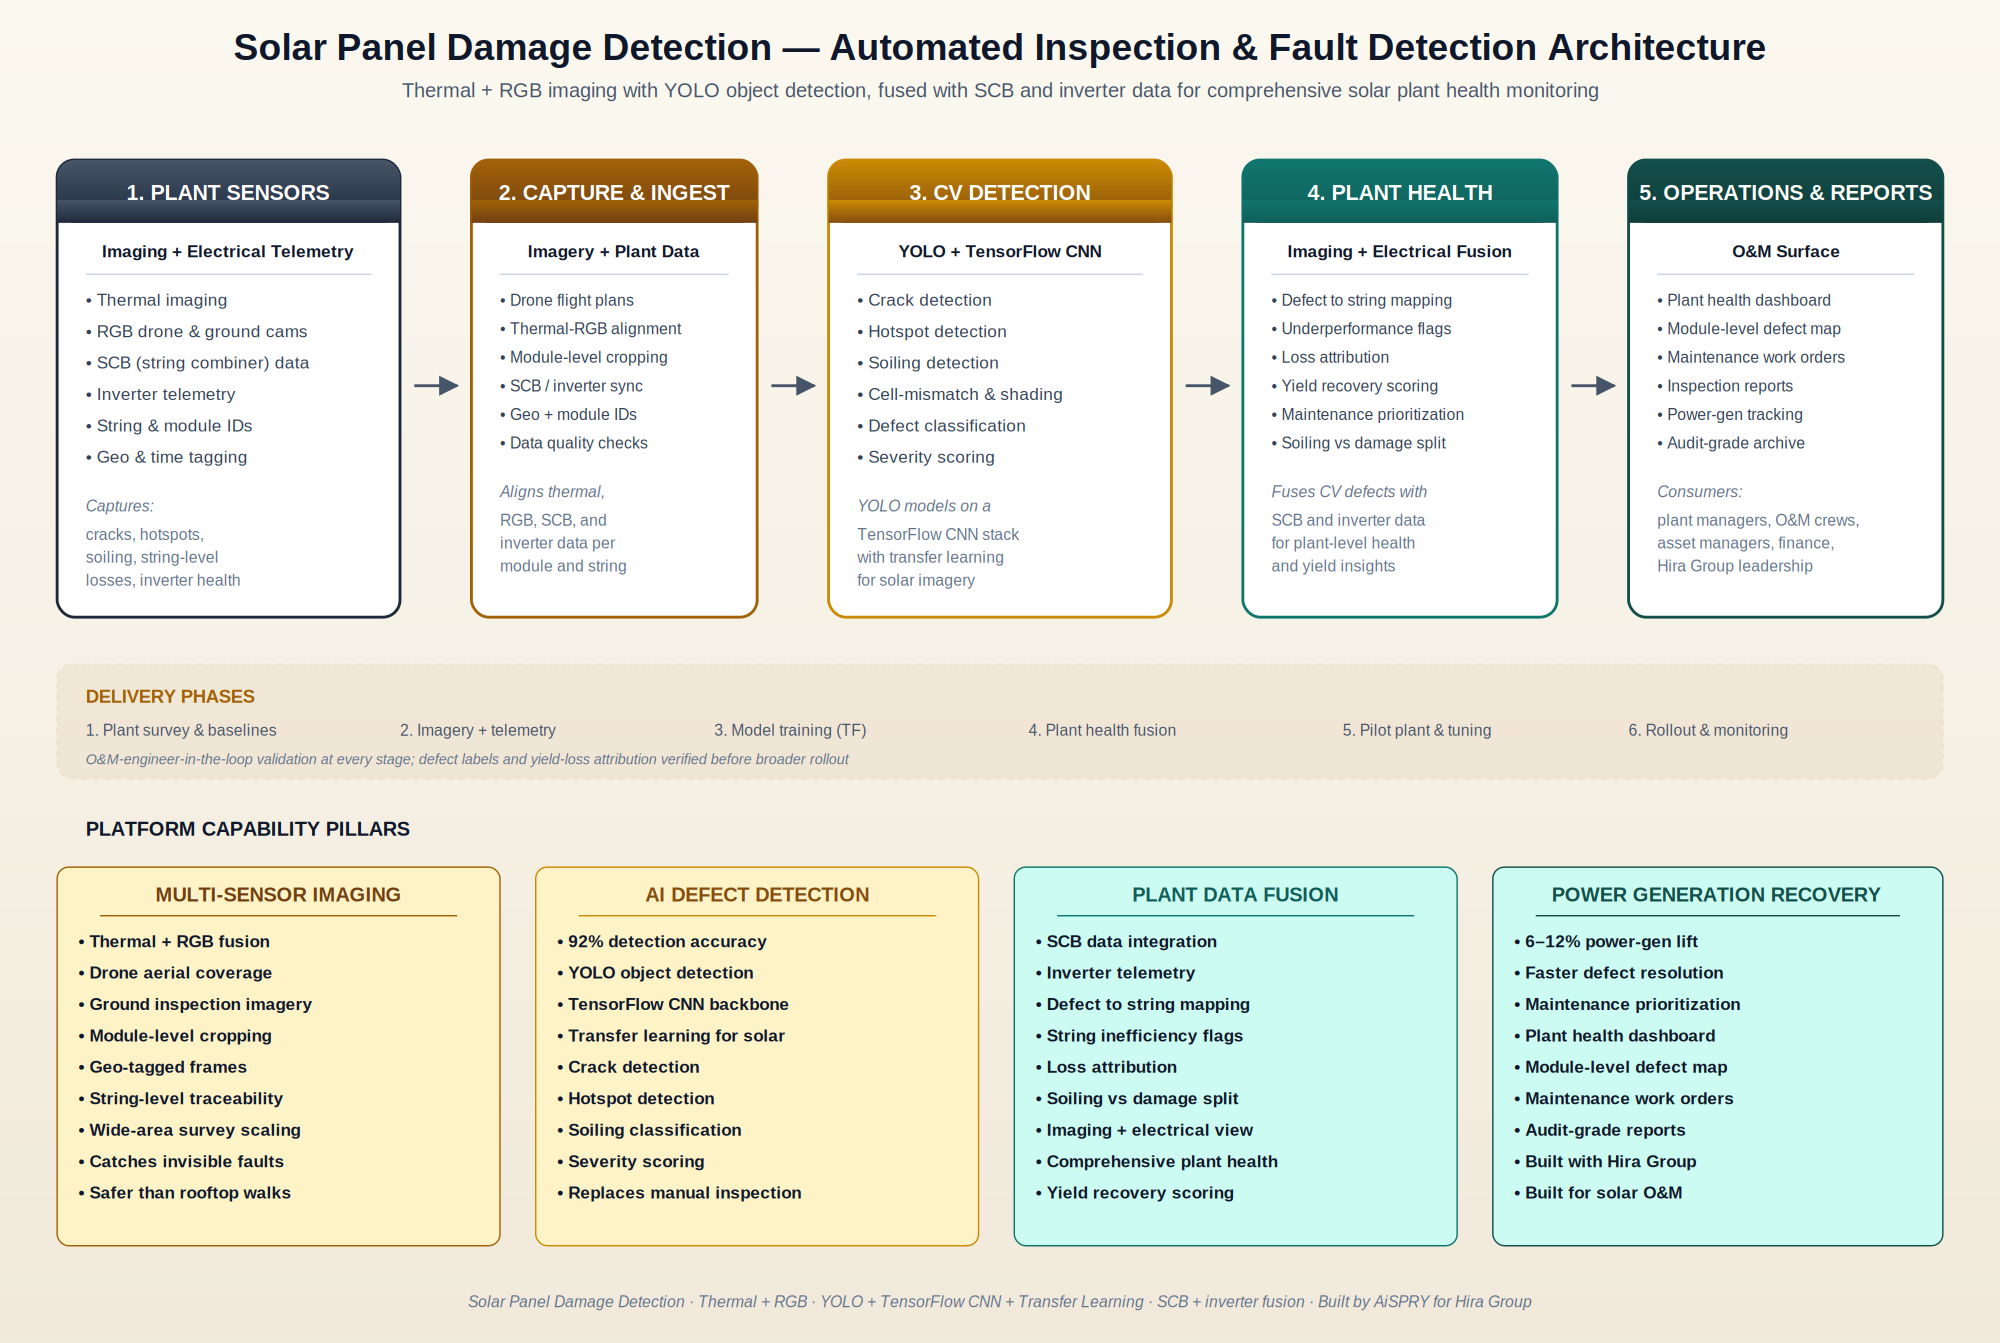
How does the platform handle imaging + electrical, plant scale, and audit?
Solar plant inspection — wide-area, weather-exposed, safety-sensitive, and tied directly to revenue — imposes a specific set of constraints that an off-the-shelf computer vision model cannot meet. AiSPRY engineered around four.
Imaging and electrical fusion
- Pure CV inspection finds defects but doesn't quantify their financial impact
- Pure electrical analysis finds underperformance but doesn't localize the cause
- Platform fuses both — every defect tied to its string, every string tied to its electrical loss
- Soiling-vs-damage split prevents mis-prioritization of maintenance
Trained on solar-specific imagery and plant-scale
- Transfer learning on TensorFlow CNN backbones bootstraps general vision into solar specifics
- Models retrained as Hira Group's data accumulates
- Drone-based imaging sweeps multi-MW plants in hours, not weeks
- Ground inspection extends coverage where drones cannot reach
Auditable, actionable, operational
- Every defect carries a module ID, location, class, severity, and timestamp
- Defect-to-yield-loss attribution makes the financial case visible for every action
- Maintenance work orders flow into the O&M workflow, not into PDF reports nobody reads
- Audit-grade archive supports financial reporting, asset management, and regulator review
What measurable results does the solar platform deliver?
The platform was engineered against two headline metrics — defect detection accuracy and power generation improvement — both moved sharply in the right direction. Beyond the headline numbers, the platform shifts solar O&M from slow, expensive, and partially-blind inspection to fast, AI-driven, electrically-fused plant health management.
Detection accuracy and inspection scale
- 92% defect detection accuracy across cracks, hotspots, soiling, and other defect classes
- Drone-based imaging sweeps multi-MW plants in hours rather than weeks
- Module-level defect identification with string-level traceability
- Replaces expensive, slow, and partially-blind manual inspection
Power generation and yield recovery
- 6–12% improvement in power generation across Hira Group's solar fleet
- Yield recovery scoring prioritizes the highest-impact defects first
- Soiling-vs-damage split directs cleaning and replacement work appropriately
- Underperforming strings surfaced and resolved before quarter-end financial impact
Plant health management and governance
- Comprehensive plant health view joining imaging and electrical data
- Module-level defect map and severity overlays guide maintenance prioritization
- Audit-grade archive supports financial reporting and asset management
- Foundation for predictive degradation, lifecycle modelling, and yield forecasting
Solar Panel Damage Detection — frequently asked questions
Below are the most common questions about how the platform works, what it detects, and how it integrates with solar plant operations.