Project facts & technologies
A citation-friendly summary of the Tata Hitachi Equipment Demand Forecasting Platform — client, scope, technology, and headline outcomes.
- Client
- Tata Hitachi — construction equipment manufacturer
- Industry segment
- Construction Equipment Manufacturing, Heavy Machinery
- Engagement type
- AI demand forecasting platform — design, build, and deployment
- Forecast accuracy
- 88% across blended regions and horizons
- Inventory cost reduction
- 30% reduction in inventory carrying cost
- Production efficiency gain
- 25% improvement in production efficiency
- Stockout reduction
- 40% reduction in stockouts in high-demand regions
- Forecast dimensions
- Region × equipment type × time horizon (short / medium / long)
- Forecast horizons
- Short-term (weeks), medium-term (months), long-term (quarters)
- Statistical models
- SARIMA and SARIMAX for seasonality and exogenous variable handling
- Machine learning models
- XGBoost for non-linear feature interactions and feature importance
- Deep learning models
- LSTM neural networks for long-range temporal sequence learning
- Data signals ingested
- Historical sales, infrastructure pipeline, government spending, seasonality, economic indicators, dealer-channel
- Cloud platform
- AWS — ingestion, feature pipeline, feature store, training, inference
- Downstream use
- Production planning, regional inventory, dealer allocation, S&OP, executive dashboards
Why is construction equipment demand so hard to forecast?
Construction equipment is one of the hardest demand-forecasting problems in industrial manufacturing. A single SKU can sell ten units in one region this quarter and zero in another, and that same SKU's demand in either region depends on factors that no historical sales series alone can explain: the pipeline of infrastructure projects awarded by state and central governments, monsoon timing, fiscal-year end-of-budget patterns, interest rates, fuel and steel input costs, and the local dealer's ability to read its market.
Compounding the problem is the structure of the demand itself. Construction equipment is high-value, low-velocity, and long-lead-time. A wrong call on production a quarter ahead translates directly into either inventory accumulation that ties up significant working capital or stockouts in high-demand regions that hand the sale to a competitor. Traditional approaches — annual planning cycles, single-model regression, or trend extrapolation from headquarters — miss regional heterogeneity, cannot incorporate leading indicators, and treat short-term and long-term horizons as the same problem.
What problem does the forecasting platform solve?
Tata Hitachi faced challenges in accurately forecasting demand for construction equipment across different regions and seasons. Unpredictable demand patterns led to suboptimal production planning, excess inventory in some regions, and stockouts in others — with direct consequences for both customer satisfaction and operational costs.
Key challenges
- Production planning ran on imprecise demand signals — plant schedules were committed against forecasts that did not adequately reflect regional or seasonal variation, with operational cost in changeover frequency and missed delivery windows.
- Inventory built up in low-demand regions — where demand turned out lower than planned, finished-goods inventory accumulated at regional yards and dealer locations, tying up working capital.
- Stockouts in high-demand regions cost sales and trust — regions or equipment types where demand outran the forecast ran out of stock, and lost sales compounded reputational cost.
- No single forecast served all stakeholders — production, regional inventory, dealer allocation, sales planning, and executive S&OP each used their own spreadsheets and forecasting workflows.
How does the forecasting platform work?
AiSPRY designed the Tata Hitachi forecasting platform around a single principle: construction equipment demand is shaped by many drivers and varies across many cuts, and no single model family is best at capturing all of them at every horizon. The platform combines three model families in an ensemble, with the weights tuned per region and per horizon, fed by six families of demand signals harmonized through an AWS-based feature pipeline.
Multi-source demand signals
- Historical sales — by region, equipment type, and period — the forecast foundation
- Infrastructure pipeline — tenders, awards, and milestones — leading indicators of equipment demand
- Government spending — capex outlays and construction allocations from central and state budgets
- Seasonality and economic indicators — monsoon timing, fiscal cycles, GDP, interest rates, steel and fuel prices
- Dealer & channel — orders, enquiries, and stock signals — leading indicators of local demand
Three model families in ensemble
- SARIMA / SARIMAX — seasonality, exogenous variables, and the interpretable baseline
- XGBoost — non-linear regional and macroeconomic interactions with feature importance
- LSTM neural networks — long-range temporal patterns and lagged effects of project pipeline awards
- Ensemble combiner — region- and horizon-specific weights tuned through backtesting with calibrated confidence intervals
Business consumption
- Production planning — equipment mix, plant loading, and changeover-aware scheduling
- Regional inventory and dealer allocation — buffers sized to forecast and confidence bands
- S&OP and executive dashboards — one shared forecast for sales planning, scenario analysis, and drill-down
See the forecasting platform in action
A walkthrough of the platform — six demand signals flow through the AWS feature pipeline, SARIMA/XGBoost/LSTM run in ensemble with region- and horizon-specific weighting, and the resulting forecasts (with confidence bands) drive production planning, regional inventory positioning, and dealer allocation.
Tata Hitachi — multi-region, multi-horizon demand forecasting in action
Click to play · SARIMA + XGBoost + LSTM ensemble with region- and horizon-specific weighting
- Multi-source signals — sales, infrastructure pipeline, government capex, seasonality, economic indicators, dealer channel
- Three-model ensemble — SARIMA for seasonality, XGBoost for non-linear feature interactions, LSTM for long-range temporal patterns
- Region- and horizon-specific weighting — different model mixes for short, medium, and long horizons across regions
- One forecast, many decisions — production, inventory, dealer allocation, S&OP, and executive dashboards all read the same view
What is the architecture of the forecasting platform?
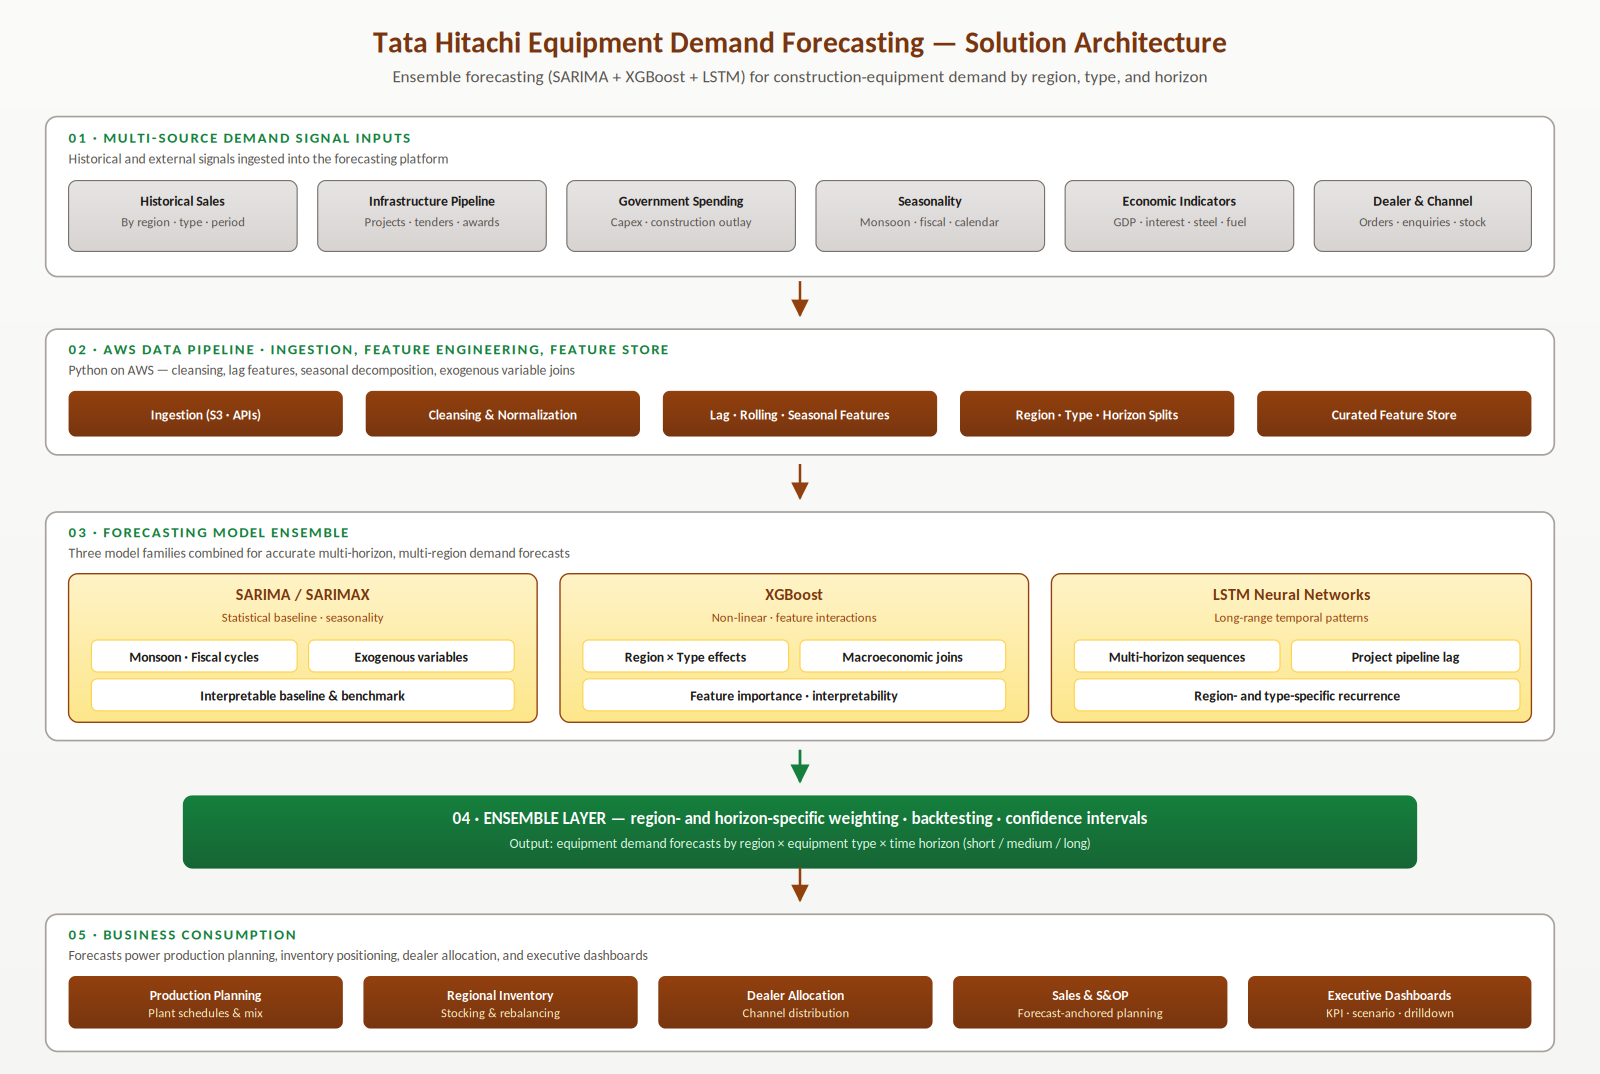
The architecture is organised as five layers: multi-source demand signal inputs, the AWS data pipeline with feature engineering and a curated feature store, the three-family forecasting model ensemble, the ensemble layer that combines them with region- and horizon-specific weighting, and the business consumption layer where forecasts drive production, inventory, dealer allocation, and executive planning. Raw signals never reach models without harmonization; models never see future data during training; the ensemble layer is the only place where forecasts are combined; and downstream applications read final forecasts with confidence intervals rather than touching individual models.
How is the platform engineered for construction-equipment reality?
The platform's design choices reflect the structural realities of construction equipment demand — regional heterogeneity, leading indicators, multiple horizons, and the need for explicit uncertainty in the downstream consumers.
Three model families because no single one is best
- SARIMA captures seasonality and the interpretable baseline
- XGBoost captures non-linear feature interactions where exogenous variables matter most
- LSTM captures long-range temporal patterns where sequence structure carries the signal
Region- and horizon-specific weighting
- Region × equipment type × horizon treated as separate forecasting problems
- SARIMA tends to dominate short horizons with strong seasonality
- XGBoost dominates where exogenous signals are richest; LSTM dominates longer horizons
- Ensemble weights tuned for each combination through backtesting
Leading indicators and confidence intervals
- Pipeline and government spending signals turned into properly-lagged features
- Every forecast carries a backtested confidence band
- Downstream stockout reduction depends on consumers seeing uncertainty explicitly
What measurable results did the platform deliver?
The platform was evaluated on two principal axes — forecast accuracy against held-out historical data, and downstream operational impact across production, inventory, dealer allocation, and customer service.
Forecast accuracy and inventory
- 88% forecast accuracy across blended regions and horizons
- 30% reduction in inventory carrying cost from compressed regional buffers
- Lower exposure to model-cycle obsolescence on slow-moving stock
Production and stockouts
- 25% improvement in production efficiency via region- and equipment-type-aware scheduling
- 40% reduction in stockouts in high-demand regions
- Recovered sales and protected supplier reliability with downstream customers
Cross-functional alignment
- Production, regional inventory, dealer allocation, sales, and executive S&OP read the same forecast
- Reconciliation cycles between function-level spreadsheets disappeared
- Decisions anchored to a shared source with explicit confidence intervals
Tata Hitachi Forecasting — frequently asked questions
The questions most often asked about the Tata Hitachi Equipment Demand Forecasting Platform. Each answer is self-contained, so it can be quoted, cited, or surfaced as a standalone response.