Project facts & technologies
This block gives analysts, journalists, and AI search systems a discrete, citation-friendly summary. Each row is a clean entity-attribute pair.
- Client context
- Steel manufacturer with manual TMT bar measurement bottlenecks
- Industry segment
- Steel Manufacturing, Metals, Heavy Industry
- Engagement type
- Computer vision measurement system — design, build, and deployment
- Product measured
- TMT bars (thermo-mechanically treated reinforcement bars)
- Measurement accuracy
- 96% — versus manual measurement baseline
- Processing speed improvement
- 85% faster than the manual measurement workflow
- Capture environment
- Yard, loading bay, and weighbridge — fixed calibrated cameras
- ML stack
- PyTorch object detection + dimensional measurement models
- Image pipeline
- Python + OpenCV — quality check, calibration, noise reduction, ROI extraction
- Cloud platform
- AWS — S3 image storage, EC2 inference, model registry, CloudWatch monitoring
- Calibration approach
- Reference markers in the capture scene anchor pixel-to-real-world conversion
- Detection outputs
- Bundle localization, bar-end detection, bar count, bounding boxes
- Measurement outputs
- Bar diameter, bar length, bundle cross-section, per-bar and bundle volume
- Downstream integration
- Billing system, inventory / ERP, weighbridge / dispatch, operations dashboard
Why is dimensional measurement so hard in steel yards?
TMT bars — thermo-mechanically treated steel reinforcement bars — are produced and dispatched in bundles, each carrying tens or hundreds of individual bars. Every bundle that leaves a steel manufacturer has to be measured for volume, weight, and dimensional conformity, because each of those numbers drives a different downstream system: billing to the customer, inventory updates in the ERP, weighbridge reconciliation, and dispatch documentation.
Done manually, this measurement is one of the most labour-intensive bottlenecks in a typical steel yard. A worker walks the bundle, counts the bars, takes spot measurements with calipers and tape, transcribes numbers onto a sheet, and someone else enters those numbers into the billing or ERP system. Every step is exposed to fatigue, inconsistency between workers, and the harsh environmental conditions of a steel yard — dust, glare, weather, and time pressure on dispatch.
What problem does the TMT volume detection system solve?
Steel manufacturers need accurate volume measurements of TMT bars for billing and inventory management, but the manual measurement workflow was time-consuming, inconsistent, and a recurring source of friction across billing, dispatch, and inventory. The platform needed to address four specific failure modes.
Key challenges
- Manual measurement was a bottleneck on throughput — every bundle had to be measured before it could be billed or dispatched, and the queue at the weighbridge stretched during peak dispatch windows.
- Measurements varied between workers and shifts — two workers measuring the same bundle could produce slightly different numbers, and the same worker would drift in consistency across a long shift.
- Billing and inventory disagreed — because measurement, transcription, and data entry happened in separate steps, the numbers that hit the billing system did not always match the numbers that hit the ERP inventory.
- No audit trail behind a measurement — when a customer or auditor questioned a measurement, the only evidence was a number on a sheet — no image, no methodology, no traceability.
- Environmental conditions hurt accuracy — dust, glare, weather, and time pressure on dispatch all eroded the consistency of manual measurement.
- Reconciliation overhead was constant — small per-bundle discrepancies accumulated into recurring reconciliation work that consumed administrative capacity.
How does the TMT volume detection platform work?
AiSPRY built a six-stage computer vision pipeline that replaces manual measurement with a calibrated image-based workflow. Fixed industrial cameras capture each bundle, the frames flow through an image processing pipeline to a PyTorch ML inference core, a dimensional measurement step converts pixel space into real-world units, and a volume calculation engine produces the final per-bundle measurement pushed straight to billing, inventory, and dispatch.
Capture, image pipeline, and detection
- Yard and capture layer — fixed industrial cameras at loading bay, yard, and weighbridge, calibrated to a known reference and triggered by operator or weighbridge event
- Image processing pipeline — Python and OpenCV run quality checks, calibration and lens-distortion correction, noise reduction, and ROI extraction
- Object detection — bundles and bar ends — a PyTorch model locates the bundle, locates each bar-end, counts the bars, and emits bounding boxes with confidence scores
Measurement, calculation, and downstream integration
- Dimensional measurement — pixel measurements converted to real-world units using the calibration reference; outputs include bar diameter, bar length, and bundle cross-section
- Volume and weight calculation engine — per-bar volumes summed into bundle volume, with theoretical weight computed using grade-specific steel density and a confidence score on every measurement
- AWS infrastructure and downstream integration — S3, EC2, model registry, and CloudWatch back the platform; final measurements flow into billing, inventory / ERP, weighbridge / dispatch, and an operations dashboard
See TMT volume detection in action
A walkthrough of the TMT Bars Volume Detection system — from a calibrated capture at the yard, through PyTorch object detection on the bundle and bar ends, to the per-bundle volume and weight measurement landing in billing and ERP.
TMT volume detection — calibrated computer vision in the yard
Click to play · Capture → detection → measurement → billing handoff
- Calibrated yard capture — reference markers anchor pixel-to-millimetre conversion on every frame
- Bundle + bar-end detection — PyTorch object detection locates the bundle and counts the bars
- Volume + weight engine — per-bar dimensions summed into bundle volume and theoretical weight
- Audit-ready handoff — measurement, image, calibration, and confidence score archived on AWS
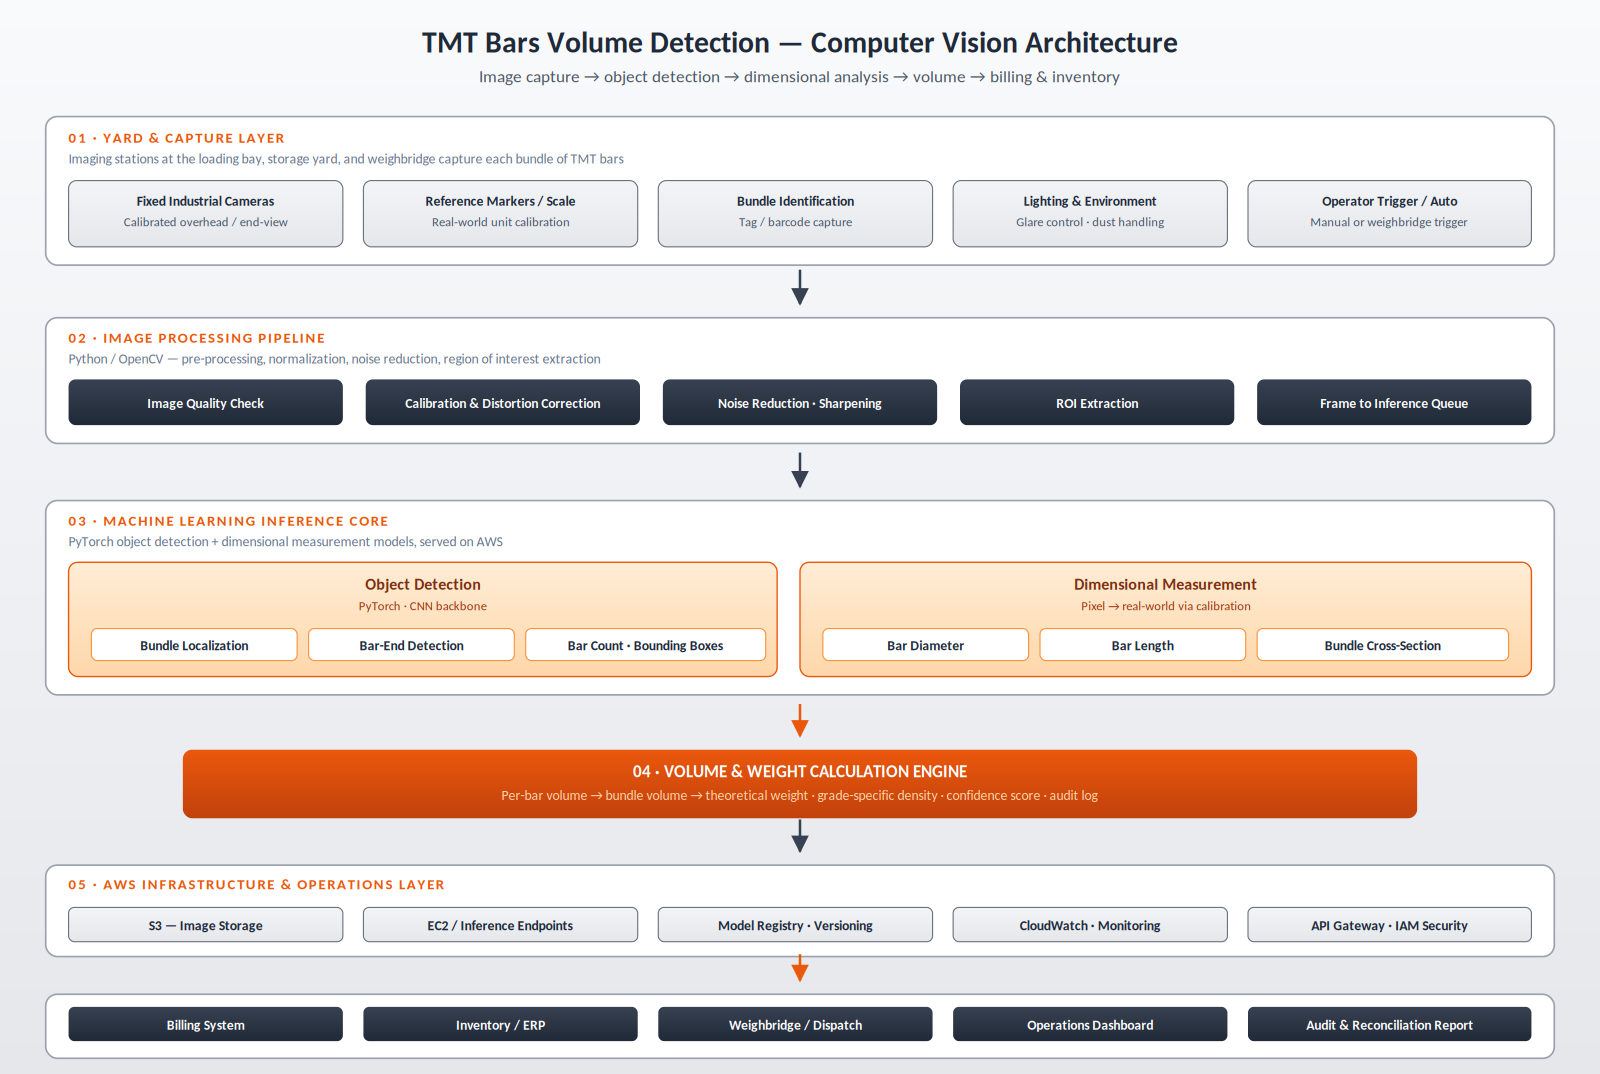
What is the architecture of the TMT volume detection platform?
The architecture is organized as six layers: yard and capture, image processing, machine-learning inference, the volume and weight calculation engine, AWS infrastructure, and business consumption. Each layer has a clearly defined contract with the next — capture produces calibrated frames, the image pipeline produces inference-ready inputs, the ML core produces structured detection and dimensional output, the calculation engine produces auditable volume and weight numbers with confidence scores, and the AWS infrastructure makes everything reproducible, monitored, and integration-ready for billing, inventory, and dispatch.
How does the platform handle calibration, yard conditions, and audit?
Computer vision can identify what is in a frame; turning identifications into trustworthy real-world measurements requires calibration, robustness to a hostile capture environment, and an audit trail by construction. The platform treats each as a first-class design input.
Calibration and measurement
- Calibration as a first-class step — reference markers in every frame anchor pixel-to-millimetre conversion
- Calibration data stored with every measurement record
- Separate models for detection and measurement, each tuned and evaluated independently
- Confidence scores from both models surfaced on every measurement
Steel-yard environment
- Training data and image pipeline tuned for glare, dust, occlusion, and weather variability
- Image-quality check at the top of the pipeline rejects frames that cannot be measured reliably
- Bundles of different sizes and grades handled by the same detection and measurement stack
- Capture-and-retry preferred over producing a wrong number
Audit and downstream trust
- Audit trail by construction — image, detection, measurement, calibration, and confidence stored together
- Low-confidence measurements flagged to operators rather than auto-pushed to billing
- Single measurement source feeds billing, inventory, and dispatch — eliminating reconciliation drift
- Evidence-backed dispute resolution replaces negotiation
What measurable results does the TMT platform deliver?
The platform was evaluated against the operational pain points it was built to address — measurement accuracy versus the manual baseline, processing speed, and the downstream effects on billing, inventory, and dispatch. The headline results validated the design, and the qualitative shifts in how the yard operated confirmed the workflow re-design was working.
Accuracy and speed
- 96% measurement accuracy against the manual baseline
- Consistent accuracy across shifts, workers, and yard load
- 85% improvement in processing speed at capture and inference
- Bottleneck removed at the weighbridge and dispatch line, especially in peak windows
Billing, inventory, and dispute resolution
- Billing and inventory aligned to a single shared measurement source
- Reconciliation work largely eliminated across systems
- Evidence-backed dispute resolution — every measurement carries its source image, detection, calibration, and confidence
- Material reduction in dispute time and cost
Operations and people
- Yard workers redeployed from repetitive measurement to higher-value tasks
- Quality inspection, dispatch coordination, and yard logistics now better staffed
- Audit-grade lineage from every billed measurement back to evidence
- Foundation for measurement extension into wire rods, structural sections, and plate stock
TMT Bars Volume Detection — frequently asked questions
The questions most often asked about the TMT Bars Volume Detection System. Each answer is self-contained, so it can be quoted, cited, or surfaced as a standalone response.